Shams Analytical Lab is a blog dedicated to analytical chemistry, lab techniques, and scientific research in pharma, environment, food & materials science.
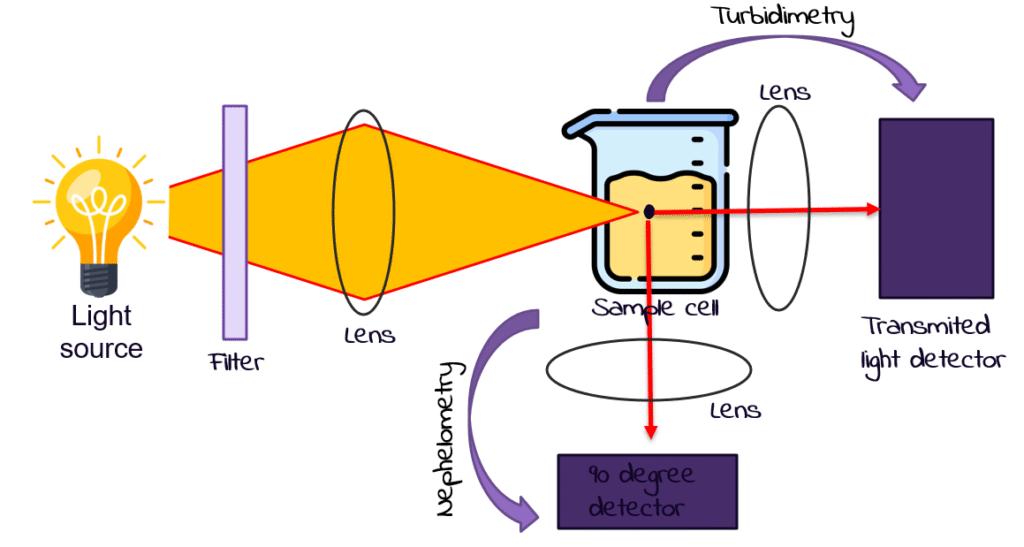
Turbidimetry is a form of test which is used to measure the concentration of suspended particles in a solution using the assistance of the obscuration of an illumination device in its course via the sample. It is based on the fact that the light is scattered or absorbed by particles of a solution due to which less light is actually sent to a detector. The more the particles, the more the turbidity and less illumination light is transmitted. [1]
2.Principle of Turbidimetry:
Law of Turbidimetry Turbidimetry: the BeerLambert law, that provides the relationship between the decreases of the light and the combination of the department and the concentration and the way length of the liquid: 𝐴 = log ( 𝐼 0 𝐼 ) = 𝑘 𝑐 𝑙 A=log( I I 0 )=kcl Where:
A = absorbance 𝐼 0
the intensity of an incidence light
𝐼 = transmitted radiated light k=constant of turbidity
𝑐 =particles concentration
L= the distance of the path of light in the sample
One application of photodetectors is in turbidimetry where a photodetector is placed at an out of phase angle of 180o relative to the shape of the light. [2]
3.Mechanism of Analyte by turbidimetric technology
Sample Preparation:
Suspended particles preparation of sample is done.
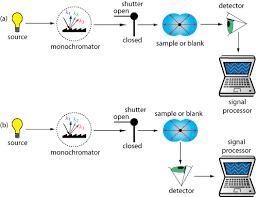
Light source:
Monochromatic light source is applied (usually a tungsten lamp or an LED lamp) through the sample
Scattering and Absorption:
It scatters and absorbs the light by the particles of the light in the solution.
Detection:
The light that was not absorbed is detected at 180 o to incident beam.
Data Analysis:
Turbidity is determined by measuring the decrease in the light which is related to the concentration of the particles. [3]
Instrumentation of Turbidimetry
There will be, under the ordinary turbid metric machine, a vertical hole, of the shape of a coffee pot, which descends through the fills.
Lamp, Light, Bubbo, Tungsten, Lamp.
Through Collimating Lens, beam is directed with the help of focus lens photodetector crash ee ee eighty-one eighty is also termed as making (informal inter; – analog/ digital meter) The substitutes to it are Nephelometry and Turbidimetry.
Differences between turbidimetry and nephelometry
Application of Turbidimetry
It was used to monitor the precipitation in drug formulae and suspensory quality control on suspensory.
1. Water Quality testing
It is used in the observation of precipitation with formulas of drugs, and in the suspension suspensory quality control. Turbidimetry plays a very significant role in water pollution monitoring as environmental departments and agencies make use of turbidimetry in determining the degree of water pollution due to the presence of organic and inorganic matter. [6]
2. Pharmaceutical Industry
It was used to monitor the precipitation at the formulas of the drugs and the
suspensory control of suspension. [7]
3. Clinical Diagnostics
It is used to determine the amount of proteins such as CRP (C-reactive protein), immunoglobulins, etc. in the blood serum by means of measuring antigen-antibody complexes in immunoturbidimetry. [8]
4.The food industry of the Metal Beverage Food
Follows liquids that are transparent like beer, wine and juices. The turbidity gives an indication of the contamination by either microbial or particles. [9]
5. Microbiological Assays:
It has been used in microbiology as a way of estimating the growth of a bacterial population based on media turbidity. Optical density is associated with the ability of the microbial cell to increase its density. [10]
7. The Advantages of the Turbidimetry
Gravity of being (easy) The former, which is really quicker (gravity of being)
Non-destructive Cost-effective
Limitations
Also, there aplasia of nephelometry led to insensitiveness of direction
The shape and size have the ability to change the accuracy of the particle.
There is a requirement of cuvettes, calibration cuvettes and clean cuvettes
Q: Explain nuclear spin, magnetic fields, and resonance. Describe chemical shift, coupling, and integration. Components of NMR spectrometer (magnet, RF generator, detector). Discuss ¹HNMR and ¹³CNMR. Provide five applications of NMR spectrometry.
Introduction: Nuclear Magnetic Resonance (NMR) spectroscopy is based on how atomic nuclei interact with magnetic fields. At the core of this technique is the spin property of certain nuclei, such as ¹H and ¹³C. These spinning nuclei act like tiny magnets because of the movement of electric charge within them.
Nuclear Spin: Nuclear spin is a natural property of certain atomic nuclei. Think of it like a tiny top spinning in space. But beyond motion, this spin creates a small magnetic field because spinning charged particles (like protons) generate magnetism. This magnetic property is essential for NMR (Nuclear Magnetic Resonance) spectroscopy.
Why It Is Crucial?
Only Some Nuclei Exhibit Spin: Not all nuclei are suitable for NMR. Only those with a non-zero spin quantum number (I ≠ 0) can be detected.
For example:
¹H (proton) and ¹³C (carbon-13) have nuclear spin and are NMR-active.
¹²C, with an even number of protons and neutrons, has zero spin and does not respond to NMR.
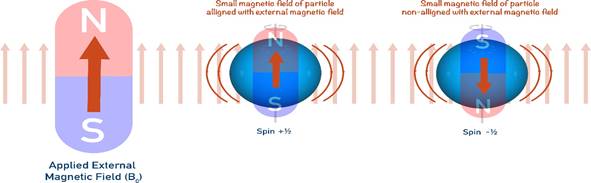
Spinning Nuclei Create Magnetic Moments: When placed in a strong magnetic field, these spinning nuclei behave like tiny bar magnets. They align in two possible ways:
With the magnetic field (lower energy state)
Against the magnetic field (higher energy state)
Magnetic Fields: In NMR spectroscopy, a strong external magnetic field (B₀) is applied to a sample. This field is created by powerful magnets inside the spectrometer. When exposed to this field, atomic nuclei with spin (like ¹H or ¹³C) act like tiny magnets. They align in one of two ways:
With the field → Lower energy
Against the field → Higher energy
This alignment creates an energy difference between the two states. NMR takes advantage of this difference to study atoms inside molecules.
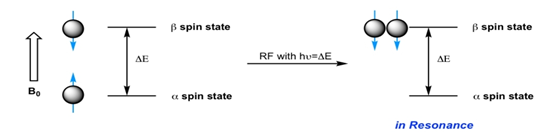
Resonance: Resonance happens when a nucleus absorbs just the right amount of energy to flip from the lower energy state to the higher one.
This is done by applying a radiofrequency (RF) pulse. When the RF pulse has the right frequency to match the energy gap between the two spin states, the nucleus absorbs the energy and flips to the higher state That’s resonance.
Each type of nucleus (¹H, ¹³C, etc.) has its own specific resonance frequency, depending on its environment. Detecting these frequencies is what allows NMR to work.
In simple terms:
External magnetic field splits spin states
RF pulse gives energy
Nucleus flips → This is resonance
We detect this flip as a signal
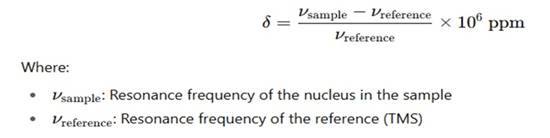
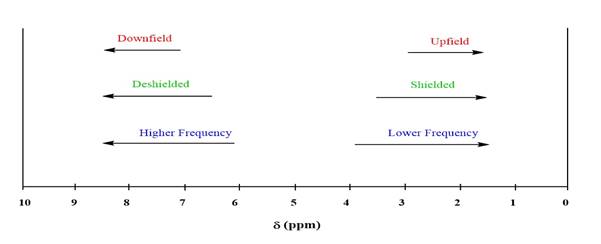
Chemical Shift (δ): It is the change in the resonance frequency of a nucleus (usually hydrogen or carbon) due to its electronic environment. It reflects how electron density around a nucleus, shields or deshields it from the external magnetic field.
Unit: Measured in parts per million (ppm) using tetramethyl silane (TMS) as the reference (0 ppm).
Interpretation: Provides information about the electronic environment; for example, protons near electronegative atoms (O, N, halogens) appear “downfield” (higher ppm) due to de-shielding.
Calculation: The chemical shift, symbolized by δ, is calculated using this formula, which helps compare how different nuclei respond in the magnetic field:
In essence, chemical shift tells us about the kinds of atoms or groups surrounding the nucleus, distinguishing between various functional groups.
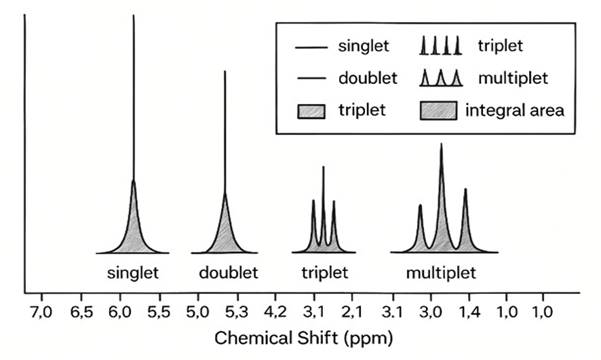
Spin-Spin Coupling (J-Coupling, Splitting): Coupling describes the splitting of NMR signals into multiplets due to interactions (through-bond) between non-equivalent neighbouring nuclei (usually protons).
Origin: Magnetic interactions between non-equivalent neighbouring nuclei cause signals to split into multiplets: singlets, doublets, triplets, quartets, etc.
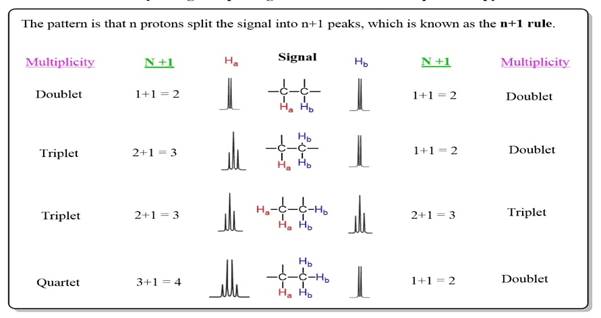
Rules of Spin-Spin Coupling:
Rule 1: Chemically equivalent protons do not split each other’s signals.
Rule 2: The signal of a proton with ‘n’ equivalent adjacent protons will be split into a multiplet of ‘n+1’ peaks.
Rule 3: The coupling constant (J) is the same for both groups of protons that are coupled to each other.
Complex cases: If multiple coupling partners have different J values, they can produce more complex or overlapping patterns, often simplifying to fewer visible peaks if J values coincide.
Key Features:
The number of splits is n+1, where n is the number of adjacent equivalent protons.
The spacing between peaks, called the coupling constant (J, in Hz), tells us how nearby nuclei are interacting and what kind they are.
Interpretation: Coupling patterns help deduce the number and arrangement of neighbouring nuclei, vital for structure determination.
Coupling patterns can reveal whether protons are on adjacent carbons, their relative positions, and even distinguish diastereotropic protons.
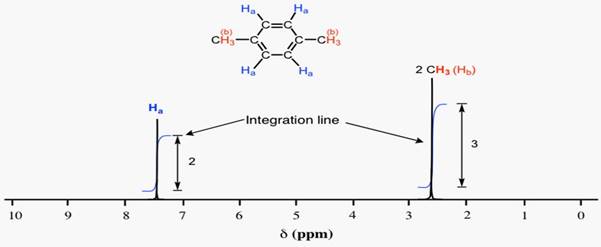
Integration (Signal area): Integration in NMR tells us the relative number of protons represented by each signal by measuring the area under the peaks.
Purpose: The integral under each multiplet is proportional to the number of nuclei contributing to that signal.
Interpretation: Integration ratios help determine relative proton counts (e.g., a 3:2 ratio corresponds to 3H vs 2H environments).
Example: If one signal integrates to twice the area of another, it corresponds to twice as many protons.
Integration is essential for confirming molecular formulas and the symmetry of molecules.
Instrumentation: The instrumentation of an NMR spectrometer includes three essential components; all working together to produce and detect the signals needed for analysis:
Magnet (Static Field Source): Typically, a superconducting magnet providing a strong, homogeneous magnetic field (usually 6–23 Tesla which corresponds to 300–1000 MHz for ¹H) contained in a cryostat cooled by liquid helium and nitrogen. It is the core of the instrument, providing the high field necessary for resonance. Homogeneity is crucial for resolution and sensitivity.
Critical attributes: Field strength, homogeneity, stability; all greatly affecting resolution and chemical shift dispersion.
Probe & RF Coil: The probe holds the sample inside the magnet (often with temperature control and shim coils) and RF coils transmit excitation pulses and detect the resulting signal (the free induction decay).
RF Transmitter & Receiver (Pulse Generator & Detector): The RF generator delivers precisely timed pulses (with stable phase memory), and the receiver amplifies weak signals from the sample, converts analogue signals to digital via an ADC, and forwards data for processing.
Shim Coil & Field Lock: Shim coils allow to make small corrections to the homogeneity of the magnetic field and a lock using deuterated solvent that can monitor field drift and correcting appropriately.
Data Acquisition & Processing System:
Hardware: A computer interface controls the spectrometer, executes pulse sequences, and collects data.
Software: Performs the following tasks:
Fourier Transform: Converts FID (time-domain signal) into frequency-domain spectrum.
Phase and Baseline Correction: Ensures clarity and accuracy of peak shapes.
Peak Picking and Integration: Quantifies signals and interprets chemical environments.
Output: A frequency-domain NMR spectrum, typically in ppm, is displayed and analyzed.
COMPONENT
DESCRIPTION/FUNCTION
Magnet
Creates a strong, consistent, and evenly distributed magnetic field (often superconducting magnets cooled with liquid helium/nitrogen).
RF Generator
Causes the nucleus to shift from a low-energy spin state to a higher-energy level.
Detector/Receiver
Detects the weak, oscillating electromagnetic signals emitted by nuclei as they relax; usually a coil perpendicular to the magnetic field.
Sample Probe
Holds the sample in a special tube within the magnetic field and transmitter/detector coils.
Console/Computer
Controls pulse sequences, processes the resulting signals, and displays spectra.
Types of NMR Spectroscopy: There are two types of NMR spectroscopy that we will discuss:
¹H NMR Spectroscopy: ¹H Nuclear Magnetic Resonance (¹H NMR) spectroscopy is a highly effective method used to identify the molecular structure of organic compounds. It detects the magnetic environments of hydrogen atoms (protons) within a molecule.
a) Chemical Shift (δ): Itis the position of the NMR signal along the spectrum; The energy axis is called a δ (delta) axis and the units are given in part per million (ppm). Most often the signal area for organic compounds ranges from 0-12 ppm. It reflects the electron density around a proton, which is influenced by nearby electronegative atoms, hybridization, and conjugation.
Typical ranges include:
0.5–1.5 ppm: Alkyl protons (e.g., CH₃, CH₂)
2–3 ppm: Protons near electronegative atoms or unsaturation
6–8 ppm: Aromatic protons
9–10 ppm: Aldehyde protons
10–12 ppm: Carboxylic acid protons
In an NMR spectrum, the right side indicates the low-energy zone, often called upfield, whereas the left side marks the high-energy region, known as downfield. Downfield simply refers to the leftward, higher energy portion of the spectrum (higher ppm) while upfield means lower energy, right side of the spectrum (lower ppm).
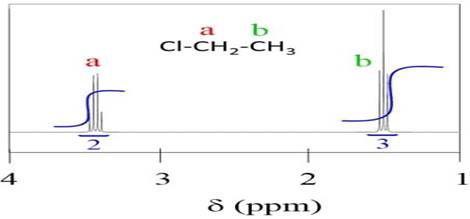
b) Integration: It refers to the area under each peak in the spectrum. More precisely, integration tells us the ratio of hydrogen atoms responsible for each signal. Take chloroethane, for instance; it shows two distinct peaks, each corresponding to a unique set of hydrogen atoms based on their chemical surroundings example, if a compound has a methyl group (CH₃) and a methylene group (CH₂), the integration ratio will reflect 3:2.
c) Spin-Spin Splitting (Multiplets): Protons on adjacent carbon atoms interact through spin-spin coupling, causing signal splitting into multiplets. The n+1 rule determines the number of peaks in a multiplet, where n is the number of equivalent neighboring protons.
Examples:
0 neighbors → singlet
1 neighbor → doublet (1:1)
2 neighbors → triplet (1:2:1)
3 neighbors → quartet (1:3:3:1)
These intensity patterns follow Pascal’s Triangle:
¹³C NMR Spectroscopy: ¹³C complements ¹H NMR by revealing details about a molecule’s carbon framework, while ¹H NMR focuses on the behavior and environment of hydrogen atoms. Signals are weaker and require more scans.
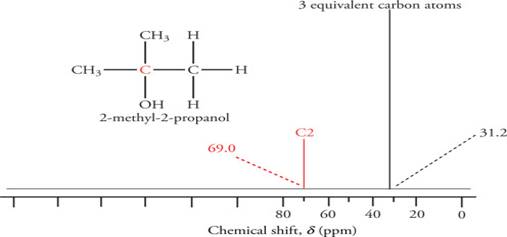
a) Chemical Shift Ranges: ¹³C nuclei exhibit a broader chemical shift range (0–220 ppm), making it easier to distinguish between different types of carbon atoms.
Typical ranges:
0–50 ppm: Saturated carbons (alkanes and CH3 groups)
50–100 ppm: Carbons bounded to electronegative atoms (alcohols, ethers, alkynes)
100–150 ppm: Unsaturated carbons (alkenes and aromatics)
EXCEPTION: Its Iodine that’s demonstrating the Heavy-Snippet-Effect. This contradicts electronegativity since a larger snippet’s huge orbital can shield carbon, which causes it to appear at a lower frequency. In the scale range, it always displays negative ppm.
b) Decoupled Spectra: By removing spin-spin splitting, ¹³C gamut’s, which constantly display proton-decoupled spectra, makes interpretation easier. The lack of carbon-carbon coupling is due to low abundance of the ¹³C isotope. Flashback, that the most current natural isotope of carbon is the 12C which is magnetically inert and infelicitous to use in NMR due to its even number of protons and neutrons. Only around the 1% of carbon atoms are the ¹³C isotope, which is why the signals in carbon NMR are faint and require more time to scan and produce a readable spectrum. Just one peak produced by each carbon terrain. Despite this, neighbouring hydrogens in ¹³C NMR cause signal splitting, which results in intricate splitting patterns.
c) DEPT Experiments: DEPT (Distortionless Enhancement by Polarization Transfer) techniques distinguish between different types of carbon atoms:
DEPT-45: Shows all protonated carbons CH, CH₂, CH₃, quaternary carbons are absent.
DEPT-90: Shows only CH (methine) carbon.
DEPT-135: CH and CH₃ appear positive; CH₂ appears negative; quaternary carbons are absent.
Hydrogen Deficiency Index (HDI):
HDI (also called Degree of Unsaturation) helps predict the number of rings and π-bonds in a molecule before NMR interpretation.
Formula:
C = number of carbon atoms
H = number of hydrogen atoms
N = number of nitrogen atoms
X = number of halogens
Use in NMR: If HDI = 4, one might expect an aromatic ring (3 double bonds + 1 ring). It helps anticipate the type and number of signals in both ¹H and ¹³C NMR.
Significance of ¹H and ¹³C NMR: Both types of NMR are widely used in various fields for:
Structure elucidation of organic compounds
Identification of functional groups
Isomer differentiation
Monitoring chemical reactions
Studying molecular dynamics like conformational changes or tautomerism
Key Applications of NMR Spectroscopy:
1. Structural Analysis in Chemistry Labs: NMR spectroscopy is a vital tool for chemists to explore and map out complex molecular structures. By observing how atomic nuclei behave in a magnetic field, researchers can determine the structure, purity, and interactions of organic compounds. It’s also used to study molecular behavior in solutions, such as phase changes and conformational dynamics.
2. Medical Imaging and Disease Diagnosis: NMR principles form the foundation of MRI scans, which are widely used in hospitals to create detailed images of internal organs. Beyond imaging, NMR plays a major role in diagnosing diseases by analyzing metabolic biomarkers; helping detect conditions like tuberculosis, pneumonia, malaria, Parkinson’s disease, and even mental health disorders like bipolar disorder and autism.
3. Food Quality and Safety Research: In the food industry, NMR spectroscopy ensures quality and safety. It helps scientists’ profile amino acids, analyze protein structures, detect carotenoids, and measure key metabolites; supporting product development and ensuring that foods meet safety standards before reaching consumers.
4. Cancer Detection and Biomarker Research: NMR is a powerful tool in cancer diagnostics. It enables scientists to monitor metabolic irregularities and identify specific biomarkers linked to cancer development. This helps in early diagnosis, treatment planning, and tracking the effectiveness of therapies.
5. Environmental Monitoring and Pollution Analysis: Environmental scientists use NMR to detect contaminants in soil, air, and water. It’s also employed to observe how living organisms react metabolically when exposed to pollutants; making it essential for pollution control, ecological risk assessments, and environmental policy development.
Conductometry is an electroanalytical technique that measures the electrical conductivity of a solution to monitor changes during a chemical reaction especially during titrations.
Why We Use Conductometry for Endpoint Detection in Titration?
Conductometric titration is used for endpoint detection due to its objectivity, precision, and adaptability:
No need for visual indicators – ideal for colored or opaque solutions.
High sensitivity to ionic concentration changes – even for dilute or weak systems.
Applicable to non-acid-base systems like precipitation, redox, and complexometric titrations.
Suitable for automation – perfect for modern analytical labs and process control.
Accuracy in difficult conditions – such as high temperatures, colored mixtures, or systems without clear pH shifts.
Types Of Titrations Where Conductometry Is Used:
TYPE
EXAMPLE
CONDUCTIVITY CHANGEPATTERN
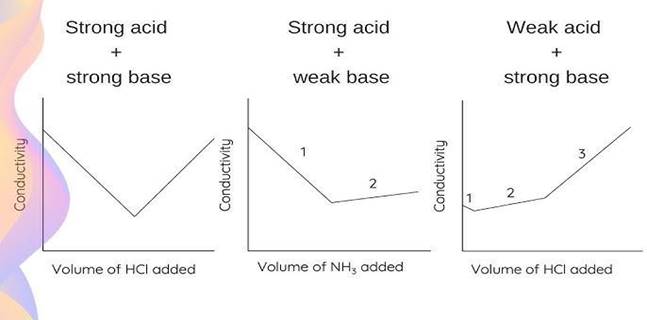
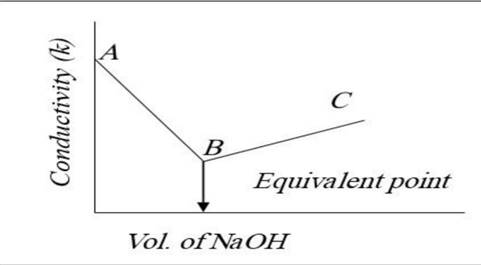
Stong Acid-Strong Base
HCL Vs NaOH
Decrease→ Minimum→ In crease
Weak Acid-Strong Base
CH3COOH Vs NaOH
Gradual decrease, then sharp increase
Strong Acid-Weak Base
HCL Vs NH4OH
Steep Decrease→ Slight Increase
Precipitation Titration
AgNO3 Vs NaCL
Sudden Drop (Ion Removed)→ Rise (Excess Titrant Ions)
Redox Titration
KMnO4 Vs H2C2O4 (Oxalic Acid)
Conductivity varies with oxidation states and products
Complexometric Titration (used when indicator is unsuitable)
The principle behind conductometric titration lies in the variation in ionic concentration that influences the conductivity of solution.
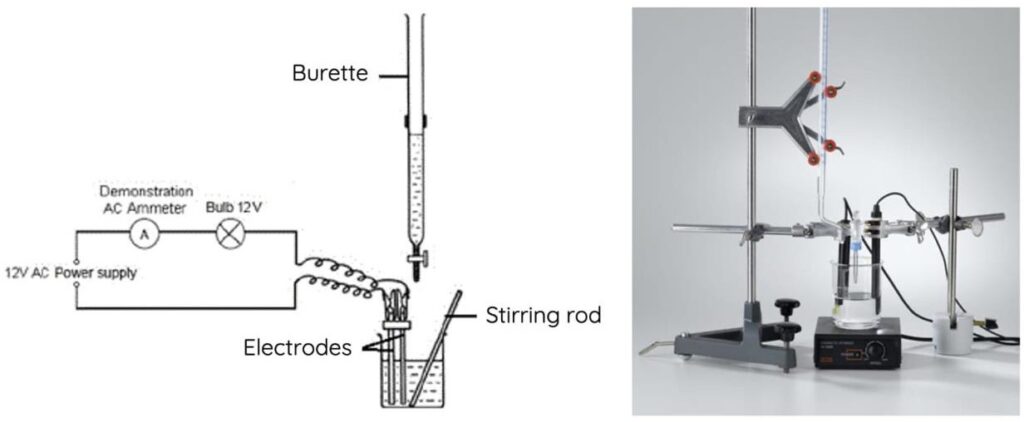
Setup and baseline reading:Measure initial conductivity based on ions present.
Upon addition of titrant:Analyte-titrant reaction changes ionic species.
Ion mobility effect:Highly mobile ions are replaced by less mobile ones, causing conductivity to drop.
At equivalence point:At stoichiometric completion, conductivity shows a distinct minimum, change in slope, or inflection means equivalence reached.
Post equivalence point:Excess titrant cause rise in conductivity again.
For instance, in titration of HCl against NaOH:
At the beginning, H⁺ ions are responsible for high conductivity.
When NaOH is added, the H⁺ ions are consumed to form water (non-conductive), and Na⁺ ions take their place, leading to a decrease in conductivity.
After the equivalence point, OH⁻ ions from excess NaOH raise conductivity again.
HCL + NaOH → H2O + NaCL
Applications: Conductometry is a powerful analytical technique that measures the electrical conductivity of ionic solutions. It finds wide application across laboratory and industrial settings due to its versatility and reliability, especially in situations where conventional indicators fail. Below are its major applications:
1. Titration in Colored, Turbid, or Indicator-Incompatible Solutions:
In cases where visual indicators are ineffective—such as colored, turbid, or transparent solutions with minimal pH changes—conductometric titration offers a reliable alternative by detecting changes in conductivity rather than relying on color change.
2. Weak Acid–Base and Non-Standard Reactions:
Conductometry is especially useful in weak acid–base titrations where minimal pH variation makes indicators unreliable. It is also applicable in reactions lacking suitable indicators or involving non-aqueous media.
3. Determination of Salt Concentrations and Solubility of Sparingly Soluble Salts:
It accurately monitors precipitation titrations (e.g., AgNO₃ vs NaCl) and determines the solubility of salts like barium or lead sulfate by measuring ion release and changes in conductivity.
4. Water Quality Assessment: Purity, Salinity, and Alkalinity:
Conductometry is widely used to:
Assess the purity of distilled or demineralized water (low conductivity indicates high purity).
Evaluate salinity in seawater and alkalinity in freshwater by detecting ionic concentrations.
5. Chemical Equilibria and Organic Compound Analysis:
It aids in:
Determining the ionic product of water (Kw).
Studying ionic equilibria during chemical reactions.
Analyzing organic acids for basicity and quantifying special compounds such as deuterium in heavy water.
6. Industrial and Automated Quality Control:
Conductometric titrations are easily automated, making them ideal for routine quality checks in the pharmaceutical, food, and water treatment industries where precision and speed are essential
Applications of Conductometry in Chemistry and Industry
Highlight practical uses:
Colored/turbid solutions
Weak acid–base titrations
Salt solubility
Water quality
Organic compound analysis
Automated quality control in labs
6. Key Advantages of Conductometric Titrations
Summarize the benefits:
No indicator needed
High precision
Ideal for automation
Works in difficult conditions
7. Conclusion: Why Conductometry Matters in Modern Analytical Chemistry
Conductometry offers a powerful, precise, and non-visual method for tracking chemical reactions. Its adaptability to weak systems, turbid mixtures, and automation makes it indispensable in analytical labs today.